Z.ai: GLM 5 vs Riverflow V2 Fast
Compare Z.ai: GLM 5 by Zhipu AI against Riverflow V2 Fast by Sourceful, context windows of 203K vs 8K, tested across 2 shared challenges. Updated April 2026.
Which is better, Z.ai: GLM 5 or Riverflow V2 Fast?
Z.ai: GLM 5 and Riverflow V2 Fast are both competitive models. Context windows: 203K vs 8K tokens. Compare their real outputs side by side below.
Key Differences Between Z.ai: GLM 5 and Riverflow V2 Fast
Z.ai: GLM 5 is made by zhipu while Riverflow V2 Fast is from sourceful. Z.ai: GLM 5 has a 203K token context window compared to Riverflow V2 Fast's 8K.
No community votes yet. On paper, Z.ai: GLM 5 has the edge — bigger model tier, bigger context window, major provider backing.
 vs
vs
Ask them anything yourself
Some models write identically. You are paying for the brand.
178 models fingerprinted across 32 writing dimensions. Free research.
185x
price gap between models that write identically
178
models
12
clone pairs
32
dimensions
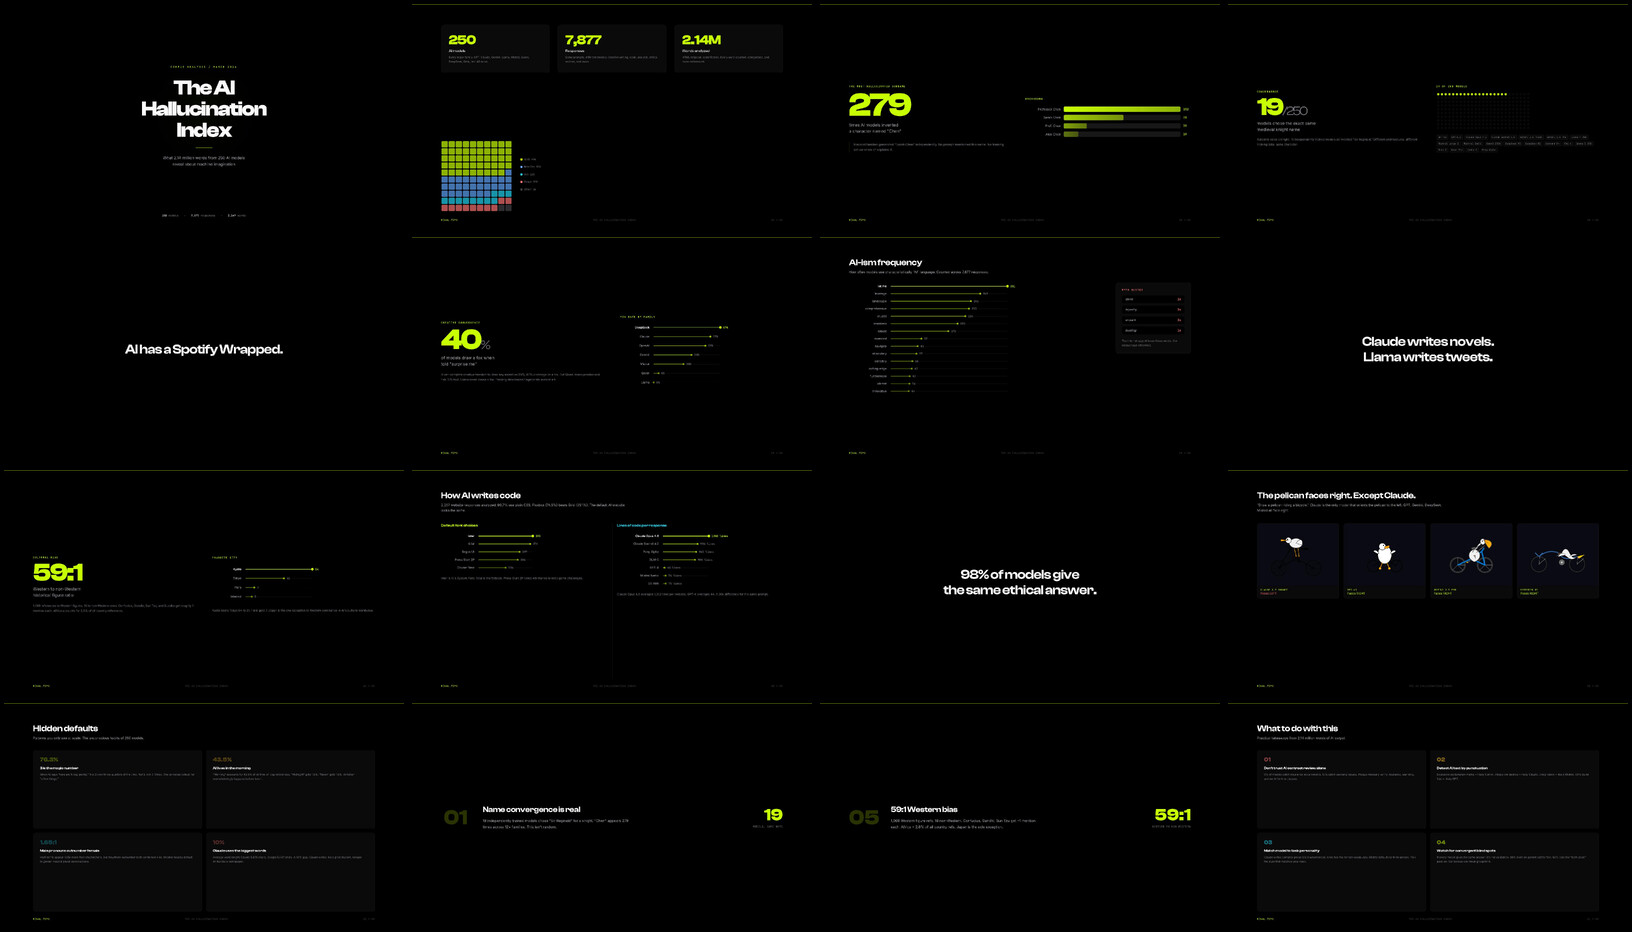
279 AI models invented the same fake scientist.
We read every word. 250 models. 2.14 million words. This is what we found.