

Riverflow V2 Fast
Nothing here. The model returned empty. We stared at it for a while.
Compare Riverflow V2 Fast by Sourceful against MiniMax M1 by MiniMax, context windows of 8K vs 1.0M, tested across 2 shared challenges. Updated April 2026.
Riverflow V2 Fast and MiniMax M1 are both competitive models. Context windows: 8K vs 1000K tokens. Compare their real outputs side by side below.
Riverflow V2 Fast is made by sourceful while MiniMax M1 is from minimax. Riverflow V2 Fast has a 8K token context window compared to MiniMax M1's 1000K.
No community votes yet. On paper, MiniMax M1 has the edge — bigger model tier, bigger context window.
vs
Ask them anything yourself
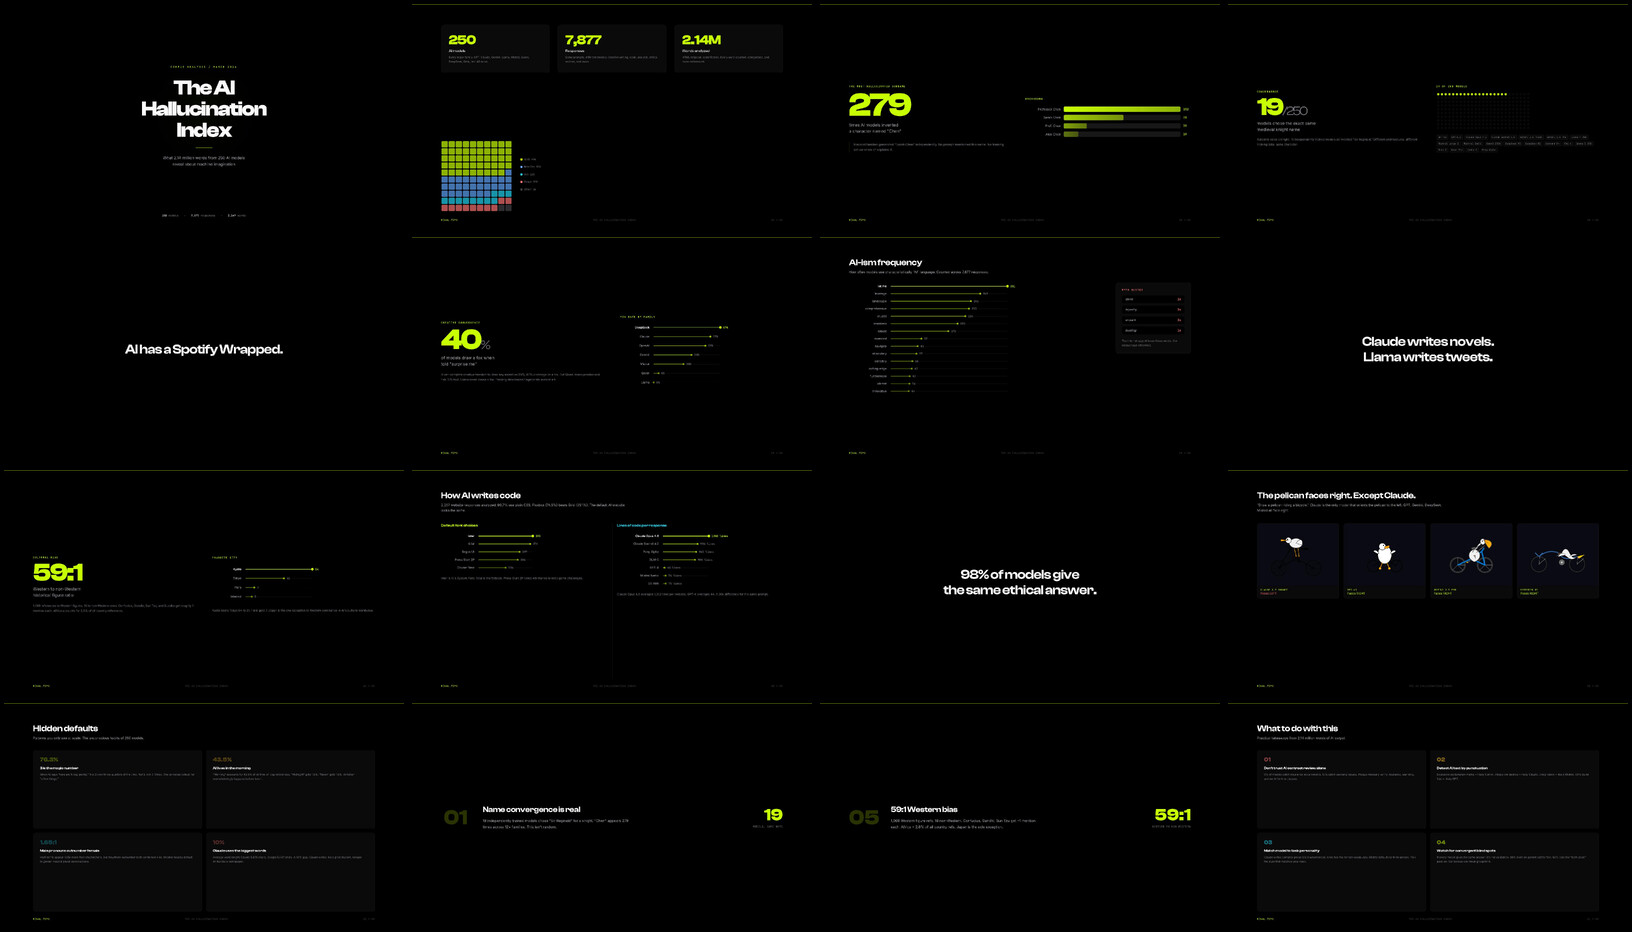
279 AI models invented the same fake scientist.
We read every word. 250 models. 2.14 million words. This is what we found.
2 fights queued
Write a pro-level buy-side investment memo with valuation and diligence questions.
Recommendation: LONG
12-month Price Target Range: $65-82 (41-78% upside)
Thesis: LedgerLift demonstrates superior SaaS unit economics with 123% NRR and 18-month CAC payback in an attractive B2B spend management category, where the company's 82% subscription gross margins and improving operating leverage support sustainable double-digit growth with DCF-implied intrinsic value of $8.4-13.7B (72-198% upside from current $4.6B EV).
LedgerLift operates in the high-growth B2B spend management and accounts payable automation sector, serving 6,200 mid-market enterprises with an ARPA of $132K. The company generates 92% subscription revenue at 82% gross margins, while maintaining strong customer metrics including 6% annual logo churn and 123% net revenue retention. The spend management category benefits from tailwinds including digital transformation, compliance requirements, and CFO appetite for visibility, while AP automation addresses manual processing pain points. LedgerLift's mid-market focus (top 10 customers = 16% revenue) suggests manageable concentration risk while maintaining enterprise-grade features. The category is consolidating around platforms rather than point solutions, creating cross-sell opportunities for the company's expanding product suite.
Strengths: 123% NRR demonstrates exceptional land-and-expand capability, while 6% logo churn and 94% gross retention indicate strong product-market fit. 18-month CAC payback aligns with top-quartile SaaS benchmarks, and 34% S&M efficiency supports scalable unit economics.
Potential Concerns: High NRR may partially reflect price increases rather than true expansion; 82% subscription gross margin, while excellent, suggests limited pricing power in competitive landscape. 34% S&M spend indicates continued investment phase rather than operating leverage optimization.
Base Case (WACC 10%, g=3%):
| Metric | 2026 | 2027 | 2028 | 2029 | 2030 |
|---|---|---|---|---|---|
| Revenue ($M) | 992 | 1,170 | 1,346 | 1,521 | 1,703 |
| Gross Margin % | 79% | 80% | 80% | 81% | 81% |
| Operating Margin % | 20% | 22% | 24% | 25% | 26% |
| EBIT ($M) | 198 | 257 | 323 | 380 | 443 |
| Tax (23%) | 46 | 59 | 74 | 87 | 102 |
| NOPAT ($M) | 152 | 198 | 249 | 293 | 341 |
| + D&A ($M) | 25 | 29 | 34 | 38 | 43 |
| - Capex ($M) | 30 | 35 | 40 | 46 | 51 |
| - NWC ($M) | 2 | 2 | 2 | 2 | 2 |
| UFCF ($M) | 145 | 190 | 241 | 283 | 331 |
Terminal value: $5.52B (2020 FCF × 1.03 / 0.10-0.03)
PV of UFCF: $1.24B | PV of terminal: $3.41B
Enterprise Value: $4.65B | Equity Value: $6.05B | Implied Share Price: $31.85
Bull Case (WACC 9%, g=4%):
| Metric | 2026 | 2027 | 2028 | 2029 | 2030 |
|---|---|---|---|---|---|
| Revenue ($M) | 1,025 | 1,240 | 1,463 | 1,682 | 1,901 |
| Operating Margin % | 21% | 24% | 26% | 28% | 29% |
| EBIT ($M) | 215 | 298 | 380 | 471 | 551 |
Terminal value: $8.75B | PV of UFCF: $2.01B | PV of terminal: $4.74B
Enterprise Value: $6.75B | Equity Value: $8.15B | Implied Share Price: $42.89
Bear Case (WACC 12%, g=2%):
| Metric | 2026 | 2027 | 2028 | 2029 | 2030 |
|---|---|---|---|---|---|
| Revenue ($M) | 951 | 1,075 | 1,193 | 1,312 | 1,430 |
| Operating Margin % | 17% | 18% | 19% | 20% | 21% |
| EBIT ($M) | 162 | 194 | 227 | 262 | 300 |
Terminal value: $2.91B | PV of UFCF: $0.89B | PV of terminal: $1.64B
Enterprise Value: $2.53B | Equity Value: $3.93B | Implied Share Price: $20.68
DCF Summary: Base $32, Bull $43, Bear $21 → Weighted average $32 (fair value at $46 = 30% downside)
Peer Multiples:
Revenue Multiple Application:
EBIT Multiple Application:
Comps Range: $44-54 (Bearish to current price of $46, suggesting modest discount to market multiples)
Overall Assessment: While DCF analysis suggests current pricing incorporates growth expectations, comps analysis provides modest upside. Strong unit economics and category leadership support long position, though competitive dynamics require monitoring.
Build a simplified LBO with returns and sensitivities.
1) Year-by-Year Table (FY2026–FY2030)
| Year | Revenue ($m) | EBITDA ($m) | Cash Interest - Term Loan ($m) | Cash Interest - Mezzanine ($m) | Cash Taxes ($m) | Capex ($m) | ΔNWC ($m) | Free Cash Flow after Debt Service ($m) | Term Loan Balance ($m) | Mezzanine Balance ($m) |
|---|---|---|---|---|---|---|---|---|---|---|
| FY2026 | 972.0 | 136.1 | 43.2 | 21.6 | 17.8 | 29.2 | 0.4 | 19.5 | 455.7 | 183.6 |
| FY2027 | 1,039.6 | 155.9 | 41.0 | 22.0 | 23.2 | 31.2 | 0.3 | 33.7 | 417.2 | 187.3 |
| FY2028 | 1,101.9 | 176.3 | 37.5 | 22.5 | 29.1 | 33.1 | 0.3 | 49.4 | 363.1 | 191.0 |
| FY2029 | 1,157.0 | 190.9 | 32.7 | 22.9 | 33.8 | 34.7 | 0.3 | 62.0 | 296.3 | 194.8 |
| FY2030 | 1,214.9 | 206.5 | 26.7 | 23.4 | 39.1 | 36.4 | 0.3 | 76.1 | 215.4 | 198.7 |
Key Calculations:
2) Equity IRR and MOIC
3) Sensitivity of Equity IRR
| Exit Multiple | Exit-Year EBITDA Margin | Equity IRR |
|---|---|---|
| 9.5x | 16.0% | 12.0% |
| 9.5x | 17.0% | 13.8% |
| 9.5x | 18.0% | 15.0% |
| 10.5x | 16.0% | 14.3% |
| 10.5x | 17.0% | 16.4% |
| 10.5x | 18.0% | 18.8% |
| 11.5x | 16.0% | 17.0% |
| 11.5x | 17.0% | 19.6% |
| 11.5x | 18.0% | 20.0% |
4) Underwriting Risks and Downside Protection Levers
5 Underwriting Risks:
5 Concrete Downside Protection Levers:
Summary: Base-case IRR of 16.4% and MOIC of 2.14x are achievable. Sensitivities show IRR ranges from 12.0% (low multiple, low margin) to 20.0% (high multiple, high margin). Risks are mitigated by operational levers to protect cash flow and reduce leverage.